California is one of the most populous states with over 39 million people. It also happens to be the state with the highest number of registered vehicles [1] with over 30 million vehicles registered as of 2020. This makes major cities like Los Angeles much more likely to experience traffic accidents due to the sheer volume of drivers on the road. Driving is still one of the most popular ways to get around and with the staggering number of cars on the road, accidents are bound to happen. The car accident statistical data that is presented below is up to date with the most recently accessible data sets provided to the public as of December 2023.
*It is important to note that there are some discrepancies between the data sets due to collection methods and sample sizes used by different referenced data sources.
5 Year Analysis of California Car Accident Statistics
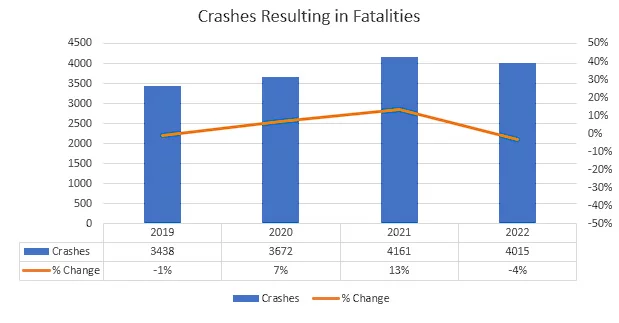
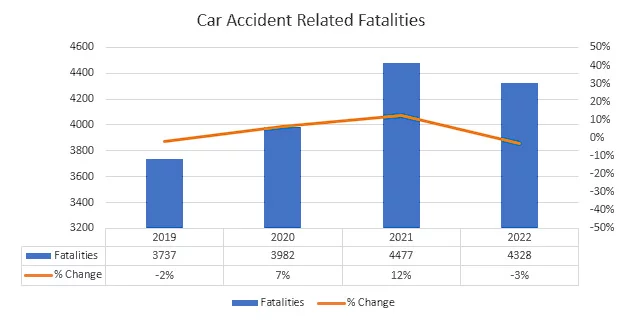
According to 2022 data pulled directly from the California Statewide Integrated Traffic Records System (SWITRS), there were 4,015 crashes that resulted in fatalities in the state of California. The combined fatality count including drivers, passengers, and victims of those accidents reaches 4,328. This metric indicates a year over year decline from the 5 year all time high benchmark of 4,477 set in 2021 [2].
| California Accident Fatality Statistics | 2018 | 2019 | 2020 | 2021 | 2022 |
| Crashes Resulting in Fatalities | 3478 | 3438 | 3672 | 4161 | 4015 |
| Year Over Year % Change | – | -1% | 7% | 13% | -4% |
| Vehicle Accident-Related Fatalities | 3804 | 3737 | 3982 | 4477 | 4328 |
| Year Over Year % Change | – | -2% | 7% | 12% | -3% |
SWITR data also indicated that crashes that resulted in fatalities and serious injuries (FSI) were down year over year by 2% when comparing 2022’s benchmark of 19,280 vehicle accident related FSI to 2021’s 5 year high of 19,593 [3].
| California Accident FSI Statistics | 2018 | 2019 | 2020 | 2021 | 2022 |
| Crashes Resulting in FSI | 17376 | 17486 | 16845 | 19593 | 19280 |
| Year Over Year % Change | – | 1% | -4% | 16% | -2% |
| Vehicle Accident Related FSI | 19962 | 20180 | 19374 | 22561 | 22128 |
| Year Over Year % Change | – | 1% | -4% | 16% | -2% |
Using the information provided by SWITR, we can deduce some additional information related to the California car accident statistics that are available to the public:
- On average, in the state of California there was 1 vehicle related accident that resulted in fatality or serious injury reported every 27 minutes in 2022.
- On average, in the state of California there was 1 person was killed roughly every 2 hours due to a traffic accident in 2022.
- For every 5 people seriously injured in a car accident in California, there was one vehicle related fatality.
California Car Accident by Cause Statistics
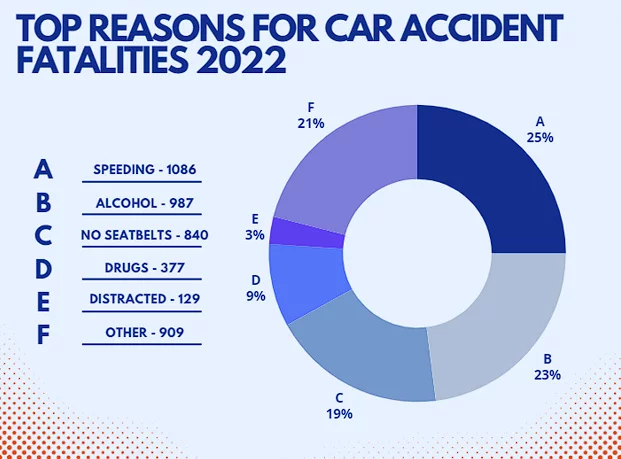
Everyone traveling in California is at risk of getting into a traffic-related accident. Learning about car accident causes can help you reduce your risk of getting into an accident and contributing to the California traffic accident statistics. In 2022, the data collected by SWITR indicated that speeding accounted for roughly 25% of all vehicle related fatalities and serious injuries, which was the leading cause followed by alcohol related fatalities and serious injuries [4].
Speeding Related Car Accident Statistics in California
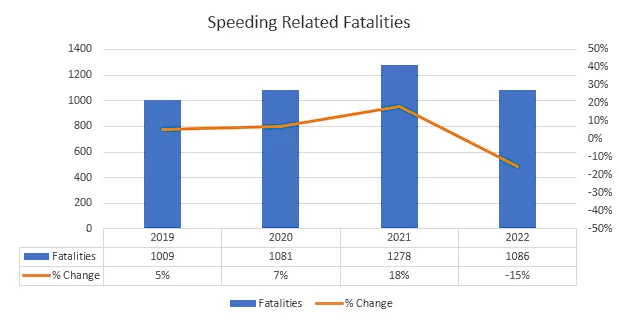
- Speeding related fatalities declined to 1,086 in 2022 from 1,278 in 2021. This marked a 15% decline which was a strong reversal from the strong 18% year over year growth experienced in 2021 [5]. Speeding related FSI benchmarks also experienced a 9% year over year decline in 2022.
| Speeding | 2018 | 2019 | 2020 | 2021 | 2022 |
| Speeding Related Fatalities | 957 | 1009 | 1081 | 1278 | 1086 |
| Year Over Year Change % | – | 5% | 7% | 18% | -15% |
| Speeding Related FSI | 5322 | 5655 | 5349 | 6248 | 5706 |
| Year Over Year Change % | – | 6% | -5% | 17% | -9% |
Alcohol Related Car Accident Statistics in California
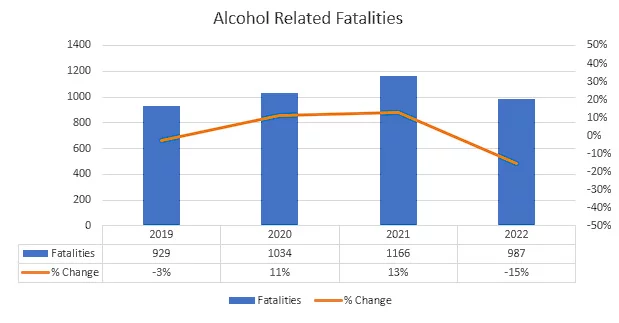
- Alcohol related driving fatalities decreased to 987 in 2022 from 1,166 in 2021 which marked a 15% year over year decline [6].This trend was a strong reversal from the previous 2 years that saw accelerating growth. Alcohol related FSI metrics also experienced a 7% decline in 2022.
| Alcohol | 2018 | 2019 | 2020 | 2021 | 2022 |
| Alcohol Related Fatalities | 956 | 929 | 1034 | 1166 | 987 |
| Year Over Year Change % | – | -3% | 11% | 13% | -15% |
| Alcohol Related FSI | 4436 | 4434 | 4259 | 5115 | 4733 |
| Year Over Year Change % | – | 0% | -4% | 20% | -7% |
Unrestrained Car Occupant Statistics in California
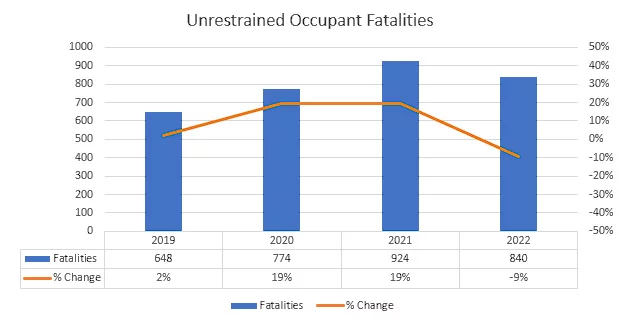
- Passengers that died due to failing to follow California seat belt laws decreased to 840 in 2022 from 924 in 2021 [7]. This marks a 9% year-over-year decline in unrestrained occupant fatalities. Unrestrained occupant related FSI continued its trend of deceleration which resulted in a 10% year over year decline in 2022.
| Unrestrained Occupant | 2018 | 2019 | 2020 | 2021 | 2022 |
| Unrestrained Occupant Related Fatalities | 633 | 648 | 774 | 924 | 840 |
| Year Over Year Change % | – | 2% | 19% | 19% | -9% |
| Unrestrained Occupant Related FSI | 2091 | 2162 | 2606 | 3020 | 2705 |
| Year Over Year Change % | – | 3% | 21% | 16% | -10% |
- In 2020, driving under the influence was the most impactful collision factor that resulted in accidents involving unrestrained vehicle occupants that resulted in fatality or serious injury. This factor resulted in 38.9%, or 883, of the 2,270 sampled crashes [8].
| Unrestrained Accident Collision Factors | # | % |
| Driving Under the Influence | 883 | 39% |
| Improper Turning | 651 | 29% |
| Unsafe Speed | 327 | 14% |
| Traffic Signals | 107 | 5% |
| Wrong Side of Road | 79 | 4% |
| Other | 222 | 10% |
- The crash type that resulted in the most unrestrained fatalities or serious injuries in 2020 were vehicles hitting objects. This accounted for 1040, or 45.8%, of the 2,270 sampled crashes [9].
| Unrestrained Accident Crash Types | # | % |
| Hit Object | 1040 | 46% |
| Overturned | 297 | 13% |
| Broadside (T-Bone) | 295 | 13% |
| Rear End | 261 | 12% |
| Head On | 243 | 11% |
| Other | 134 | 6% |
Drug Related Car Accident Statistics in California
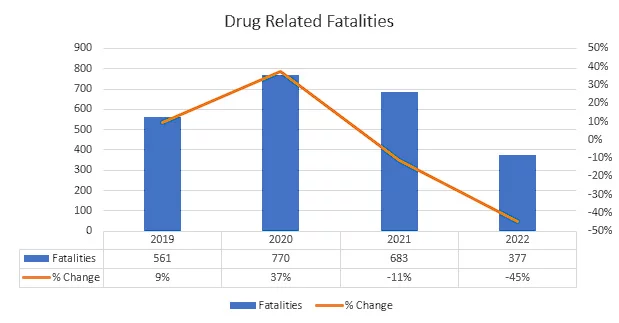
- Both fatalities and FSI metrics caused by drivers under the influence of drugs dropped dramatically in 2022. Fatalities were down by 45% with 2022 reporting only 377 drug related vehicle accidents compared to 683 in 2022. FSI metrics also dropped 38% [10].
| Drug Related | 2018 | 2019 | 2020 | 2021 | 2022 |
| Drug Related Fatalities | 513 | 561 | 770 | 683 | 377 |
| Year Over Year Change % | – | 9% | 37% | -11% | -45% |
| Drug Related FSI | 1064 | 1132 | 1415 | 1346 | 832 |
| Year Over Year Change % | – | 6% | 25% | -5% | -38% |
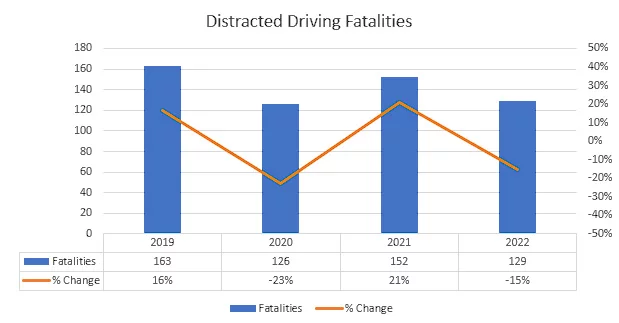
Distracted Driving Car Accident Statistics in California
- Distracted driving related fatalities reported 129 deaths in 2022 which was 15% lower than 2021’s 152 fatalities. Distracted driving FSI was down 11% when comparing 2022’s 742 fatalities and serious injuries against 2021’s 834 [11].
| Distracted Driving | 2018 | 2019 | 2020 | 2021 | 2022 |
| Distracted Driving Related Fatalities | 140 | 163 | 126 | 152 | 129 |
| Year Over Year Change % | – | 16% | -23% | 21% | -15% |
| Distracted Driving Related FSI | 882 | 950 | 761 | 834 | 742 |
| Year Over Year Change % | – | 8% | -20% | 10% | -11% |
California Car Accident by Accident Type
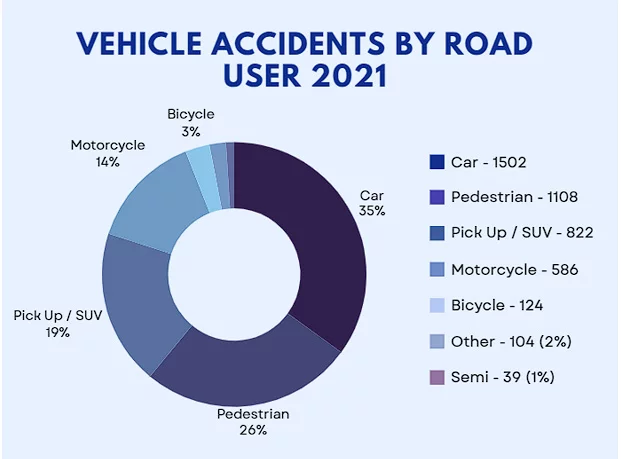
According to 2021 data provided by the Insurance Institute for Highway Safety (IIHS), there was a total of 3,983 fatal crashes which resulted in 4,285 deaths in California [12].
- Of those 4,285 deaths, the top 3 vehicle types that resulted in the most deaths were cars (35%), pickup trucks / SUVs (19%), and motorcycles (14%) [13]. Pedestrian victims also accounted for a large portion (26%) of the fatalities that resulted from vehicle crashes in California.
Motorcycle Accident Statistics in California
- Motorcycle accident deaths increased from 549 in 2020 to 565 in 2021 which indicates 2.9% year over year growth [14]. However, this is a remarkable deceleration from the 15.8% year over year increase that occurred in 2020 from 2019.
| Motorcycle Fatalities | 2018 | 2019 | 2020 | 2021 |
| Motorcycle Fatalities | 523 | 474 | 549 | 565 |
| % Change YoY | – | -9.4% | +15.8% | +2.9% |
- Motorcycle accident deaths that resulted from riders not wearing helmets experienced 8.8% year over year growth in 2021 [15]. This increase from 34 deaths in 2020 to 37 deaths in 2021 was still a deceleration from 2020’s 21.4% year-over-year growth.
| Helmet Related Motorcycle Fatalities | 2018 | 2019 | 2020 | 2021 |
| Helmet Related Motorcycle Fatalities | 34 | 28 | 34 | 37 |
| % Change YoY | – | -17.6% | +21.4% | +8.8% |
- Broadside accidents were the most common motorcycle accident type in California, accounting for roughly 850 of the 3,385 sampled crashes in 2020 [16].
| Motorcycle Accident Crash Types | # | % |
| Broadside (T-bone) | 850 | 25% |
| Overturned | 711 | 21% |
| Hit Object | 636 | 19% |
| Rear End | 423 | 13% |
| Sideswipe | 389 | 12% |
| Other | 376 | 11% |
- Unsafe speeds were the most reported cause of motorcycle accidents in California, accounting for 1,046 of the 3,385 sampled crashes in 2020 [17].
| Motorcycle Accident Crash Causes | # | % | ||
| Unsafe Speed | 1046 | 30.90% | ||
| Improper Turning | 751 | 22% | ||
| Car Right of Way | 545 | 16.10% | ||
| Riding Under the Influence | 301 | 8.90% | ||
| Traffic Signals | 149 | 4.40% | ||
| Other | 592 | 17.50% |
- Los Angeles County had the highest number of motorcycle related incidents in California and was responsible for 114 (21.1%) of reported motorcycle related fatalities and 702 (23.8%) of reported motorcycle related serious injuries in the state [18]. However, the Fatal & Serious Injury (FSI) per 100K population metric for Los Angeles was 8.15 which was below the state average of 8.83.
Pedestrian and Bicycle Accident Statistics in California
- Pedestrian related traffic fatalities experienced a 9.4% increase which grew from 1013 deaths in 2020 to 1108 deaths in 2021 [19]. This benchmark unfortunately saw the continuation of a trend that accelerated from the previous year’s 4.3% growth.
| Pedestrian Fatalities | 2018 | 2019 | 2020 | 2021 |
| Pedestrian Fatalities | 978 | 972 | 1013 | 1108 |
| % Change YoY | – | -0.6% | +4.2% | +9.4% |
- Bicycle related traffic fatalities declined by 8.1% which resulted in 125 deaths in 2021 compared to 136 deaths in 2020 [20].
| Bicycle Fatalities | 2018 | 2019 | 2020 | 2021 |
| Bicycle Fatalities | 165 | 133 | 136 | 125 |
| % Change YoY | – | -19.4% | +2.3% | -8.1% |
Los Angeles Car Accident Statistics
Los Angeles came in at the top of the list of California cities responsible for the most vehicle related fatalities and FSI. Los Angeles accounted for 8.4% of all car accident related fatalities as well as 9.9% of all fatalities and serious injuries attributed to car accidents in California. The cities that made up the top 10 list can be seen below [21].
| Cities with Most Vehicle Related Fatalities | 2022 | % |
| California (Statewide) | 4328 | 100.0% |
| Los Angeles | 363 | 8.4% |
| San Diego | 122 | 2.8% |
| Sacramento | 76 | 1.8% |
| Fresno | 63 | 1.5% |
| Long Beach | 58 | 1.3% |
| Bakersfield | 57 | 1.3% |
| Riverside | 57 | 1.3% |
| San Bernardino | 53 | 1.2% |
| Oakland | 46 | 1.1% |
| San Francisco | 43 | 1.0% |
| Cities with Most Vehicle Related FSI | 2022 | % |
| California (Statewide) | 22,128 | 100.0% |
| Los Angeles | 2,186 | 9.9% |
| San Diego | 541 | 2.4% |
| San Francisco | 349 | 1.6% |
| Sacramento | 346 | 1.6% |
| Long Beach | 321 | 1.5% |
| Fresno | 259 | 1.2% |
| San Jose | 251 | 1.1% |
| Oakland | 219 | 1.0% |
| Riverside | 204 | 0.9% |
| San Bernardino | 170 | 0.8% |
This makes sense given that Los Angeles is the largest city in California by population size and continues to be one of the most traffic congested cities in the state. However, according to the data provided by data.lacity.org, the number of car collisions in Los Angeles has dropped 3 years in a row [22].
| Year | # of Reported Collisions |
| 2023 | 15236 |
| 2022 | 16413 |
| 2021 | 18791 |
The cause of car accident-related fatalities in both the county and the city of Los Angeles matches the data identified at the state level. The top reasons include speeding, alcohol, and unrestrained occupants [23].
- LA County data:
| Fatalities – LA County | 2018 | 2019 | 2020 | 2021 | 2022 |
| Speeding | 233 | 245 | 264 | 322 | 302 |
| Year Over Year Change (%) | – | 5% | 8% | 22% | -6% |
| Alcohol Related | 174 | 144 | 175 | 148 | 120 |
| Year Over Year Change (%) | – | -17% | 22% | -15% | -19% |
| Unrestrained Occupant | 89 | 78 | 116 | 119 | 123 |
| Year Over Year Change (%) | – | -12% | 49% | 3% | 3% |
| Drug Related | 104 | 106 | 166 | 49 | 23 |
| Year Over Year Change (%) | – | 2% | 57% | -70% | -53% |
| Distracted Driving | 24 | 26 | 24 | 22 | 16 |
| Year Over Year Change (%) | – | 8% | -8% | -8% | -27% |
- LA City data:
| Fatalities – LA (City) | 2018 | 2019 | 2020 | 2021 | 2022 |
| Speeding | 90 | 103 | 101 | 151 | 127 |
| Year Over Year Change (%) | – | 14% | -2% | 50% | -16% |
| Alcohol Related | 54 | 49 | 62 | 58 | 52 |
| Year Over Year Change (%) | – | -9% | 27% | -6% | -10% |
| Unrestrained Occupant | 37 | 23 | 45 | 28 | 39 |
| Year Over Year Change (%) | – | -38% | 96% | -38% | 39% |
| Drug Related | 36 | 34 | 64 | 11 | 11 |
| Year Over Year Change (%) | – | -6% | 88% | -83% | 0% |
| Distracted Driving | 8 | 7 | 9 | 6 | 5 |
| Year Over Year Change (%) | – | -13% | 29% | -33% | -17% |
Most Dangerous Intersections in Los Angeles
According to the LAPD, the deadliest intersections in Los Angeles in 2021 [24] were:
For total collisions:
- San Pedro St. and Washington Blvd.
- Florence Ave. and Vermont Ave.
- Oxnard St. and Van Nuys Blvd.
- Highland Ave. and Hollywood Blvd.
For pedestrians:
- Caesar E. Chavez Ave. and Soto St.
- Avalon Blvd. and Imperial Highway
- De Soto Ave. and Lassen St.
- Hollywood Blvd. and Highland Ave.
For cyclists:
- Humboldt St. and San Fernando Road
- Anaheim St. and King Ave.
- Valley Vista Blvd. and Van Nuys Blvd.
- La Brea Ave. and Sunset Blvd.
How to Make LA Streets Safer
Streety safety is a basic right for everyone in Los Angeles. Unfortunately, there’s no simple solution to making LA streets safer. While agencies such as LADOT have implemented programs such as Vision Zero to try and eliminate traffic-related injuries and deaths, these measures have been largely ineffective.
Making the streets of Los Angeles safer requires numerous changes at the individual and systemic level. Both state- and city-wide level awareness programs can utilize car accident statistics like the ones analyzed above to identify where there are areas that need to be dramatically improved. By understanding how speeding, driving under the influence, and not following seatbelt and helmet laws play into increasing car and motorcycle accidents, our local and state leaders can develop plans that focus on addressing the biggest problems. New programs that increase awareness and laws that implement stricter penalties for breaking the safety rules of the road would help reduce vehicle related fatalities and serious injuries.
These measures will also require that each driver obeys traffic safety laws by slowing down and paying attention to the road. Certain at-risk demographics like motorcyclists need to follow to motorcycle helmet laws and rider training to reduce the likelihood of injury or death. Whether it’s a driver, bicyclist, or pedestrian, each person that travels throughout Los Angeles deserves to feel safe and it will take effort from every individual in the city to play their part in making the streets safe.
Schedule a Consultation with a Mesriani Car Accident Lawyer If You Have Been in a Car Accident
Getting into a car accident can be a traumatizing experience. While minor accidents may not always leave victims with significant harm, major car crashes can cause serious and fatal injuries. In California, car accident victims are entitled to compensation for their losses. If you or someone you know has been hurt in a car accident, contact Mesriani Law Group to learn more about your legal options. Our law firm have over 20 years of experience helping car accident victims get the justice they deserve. We have successfully recovered over $100 million for our clients and have consistently obtain the maximum compensation.
Whether you were injured by a negligent driver or government agency, we can represent you against the other party and help you move forward. We accept clients on a contingency basis and do not charge you anything if we do not win your case. There is strict deadline for filing personal injury claims so do not wait to start your claim. Contact us today at (866) 500-7070 for a free consultation.
Sources
[1] https://www.valuepenguin.com/auto-insurance/car-ownership-statistics#national [2] [3] [4] [5] [6] [7] [10] [11] [21] [23] https://tims.berkeley.edu/summary.php?showArea=city&expandTables=false&injury=3&yearRange=5&showMap=crashes [8] [9] https://safetrec.berkeley.edu/sites/default/files/publications/safetrecfactsoccupantprotection_2022.pdf [12] [13] https://www.iihs.org/topics/fatality-statistics/detail/state-by-state [14] [15] [19] [20] https://www.ots.ca.gov/ots-and-traffic-safety/score-card/ [16] [17] [18] https://safetrec.berkeley.edu/sites/default/files/publications/safetrecfactsmotorcyclesafety_2022.pdf [22] https://data.lacity.org/Public-Safety/Traffic-Collision-Data-from-2010-to-Present/d5tf-ez2w/data [24] https://laist.com/news/transportation/traffic-violence-surges-in-los-angeles-2021 [25] https://www.driverknowledge.com/car-accident-statistics/
Car Accident Statistic FAQs
How many car accidents happen in the U.S. in 2021?
According to the U.S. Department of Transportation’s National Highway Traffic Safety Administration (NHTSA), approximately 20,160 people died in motor vehicle crashes in the first half of 2021. That is an increase of 18.4% compared to 2020. Unfortunately, that is the largest number of projected fatalities since 2006.
How many car accidents happen a year in the U.S.?
On average, 6 million car accidents happen a year in the U.S [25]. 3 million people get hurt as a result of a car accident every year. Each day, more than 90 people die because of a car accident. Approximately 2 million drivers who get hurt due to a car crash suffer from permanent injuries each year. On average, the car crashes were 6% fatal and 27% non-fatal; 72% resulted in property damage. The most common cause of accident that resulted in death was alcohol, accounting for 40% of the crashes. Other top causes include speeding (30%) and reckless driving (33%).